Maybe you have seen applications that are live with errors or the application stops in the middle of the process we are running. Of course, this is uncomfortable because we have to repeat the process from the beginning. Processes that suddenly stop are usually called bugs. Bug itself is an error that occurs as a result of an error that occurs due to an instruction or process being executed imperfectly. The causes of bugs are many factors, perhaps the manufacturing process is not perfect, or when running a process that requires something, for example resources and that need cannot be met, a bug will arise.
The process of looking for bugs is usually called debugging or the process of searching for the line of code that causes the error to occur. A programmer will definitely be familiar with these words because it is a daily job they can do. When a bug occurs, the steps taken are usually to look at the reporting from the person reporting it, either directly from the user or a fellow developer who discovered the bug. After that, the programmer immediately traces the code that has been created and is live and then does debugging, which can be done locally or in the local environment.
So, in this post, Santekno will provide a tutorial on how to debug Golang in VSCode. Before continuing how to debug Visual Studio Code, there are several things you need to prepare.
Preparation
- You understand some Golang syntax and writing
- Make sure you have
goinstalled on your computer - Perform set
GOPATH. (by default it’s usually~/go) - Open the Visual Studio Code application
- Install plugin VSCode-Go
Once everything has been installed, when you open the .go file in VSCode, you will see at the bottom right in the status bar Install Analysis Tools. Try clicking and the link will install several Go packages so that when you continue, you can be more effective and efficient.
There is one plugin that you need to install, namely Delve. This plugin is an open-source debugger for Go language users. If you want to know more about installation, you can see.
Create Example Application Code
Santekno will create 2 sample Golang codes:
- Go program to generate a JSON
- We will write a function and create a unit test and how we do debug tests in VS Code
The following is the source code for the first example program. Create a main.go file as below
package main

import (
	"encoding/json"
	"fmt"
	"log"
)

type Pandawa struct {
	Nama         string `json:"nama"`
	Julukan      string `json:"nama_julukan"`
	Titisan      string `json:"titisan"`
	DiangkatRaja bool   `json:"raja"`
}

func (p *Pandawa) diAngkatRaja() {
	p.DiangkatRaja = true
}

func main() {
	pandawas := []Pandawa{
		{
			Nama:    "Yudistira",
			Julukan: "Dhramasuta",
			Titisan: "Dewa Yama",
		},
		{
			Nama:    "Bima",
			Julukan: "Bayusutha",
			Titisan: "Dewa Bayu",
		},
		{
			Nama:    "Arjuna",
			Julukan: "Partha",
			Titisan: "Dewa Indra",
		},
		{
			Nama:    "Nakula",
			Julukan: "pengasuh kuda",
			Titisan: "Dewa Aswin",
		},
		{
			Nama:    "Sadewa",
			Julukan: "Brihaspati",
			Titisan: "Dewa Aswin",
		},
	}

	pandawas[0].diAngkatRaja()

	jsonBytes, err := json.Marshal(pandawas)
	if err != nil {
		log.Fatalln(err)
	}
	fmt.Println(string(jsonBytes))
}
In the code above we define a Pandawa struct, and create an array from this struct, the array we first change the state by calling the diangkatRaja() function then after that convert the results to JSON and finally we print it with STDOUT.
You can see if you run the example program with
go run main.go

[{"nama":"Yudistira","nama_julukan":"Dhramasuta","titisan":"Dewa Yama","raja":true},{"nama":"Bima","nama_julukan":"Bayusutha","titisan":"Dewa Bayu","raja":false},{"nama":"Arjuna","nama_julukan":"Partha","titisan":"Dewa Indra","raja":false},{"nama":"Nakula","nama_julukan":"pengasuh kuda","titisan":"Dewa Aswin","raja":false},{"nama":"Sadewa","nama_julukan":"Brihaspati","titisan":"Dewa Aswin","raja":false}]
Debugging With Breakpoints (red dots)
To start debugging, we need some configuration, namely by pressing the Debug icon button on the left of the Visutl Studio Code panel, then select press the Run and Debug button.
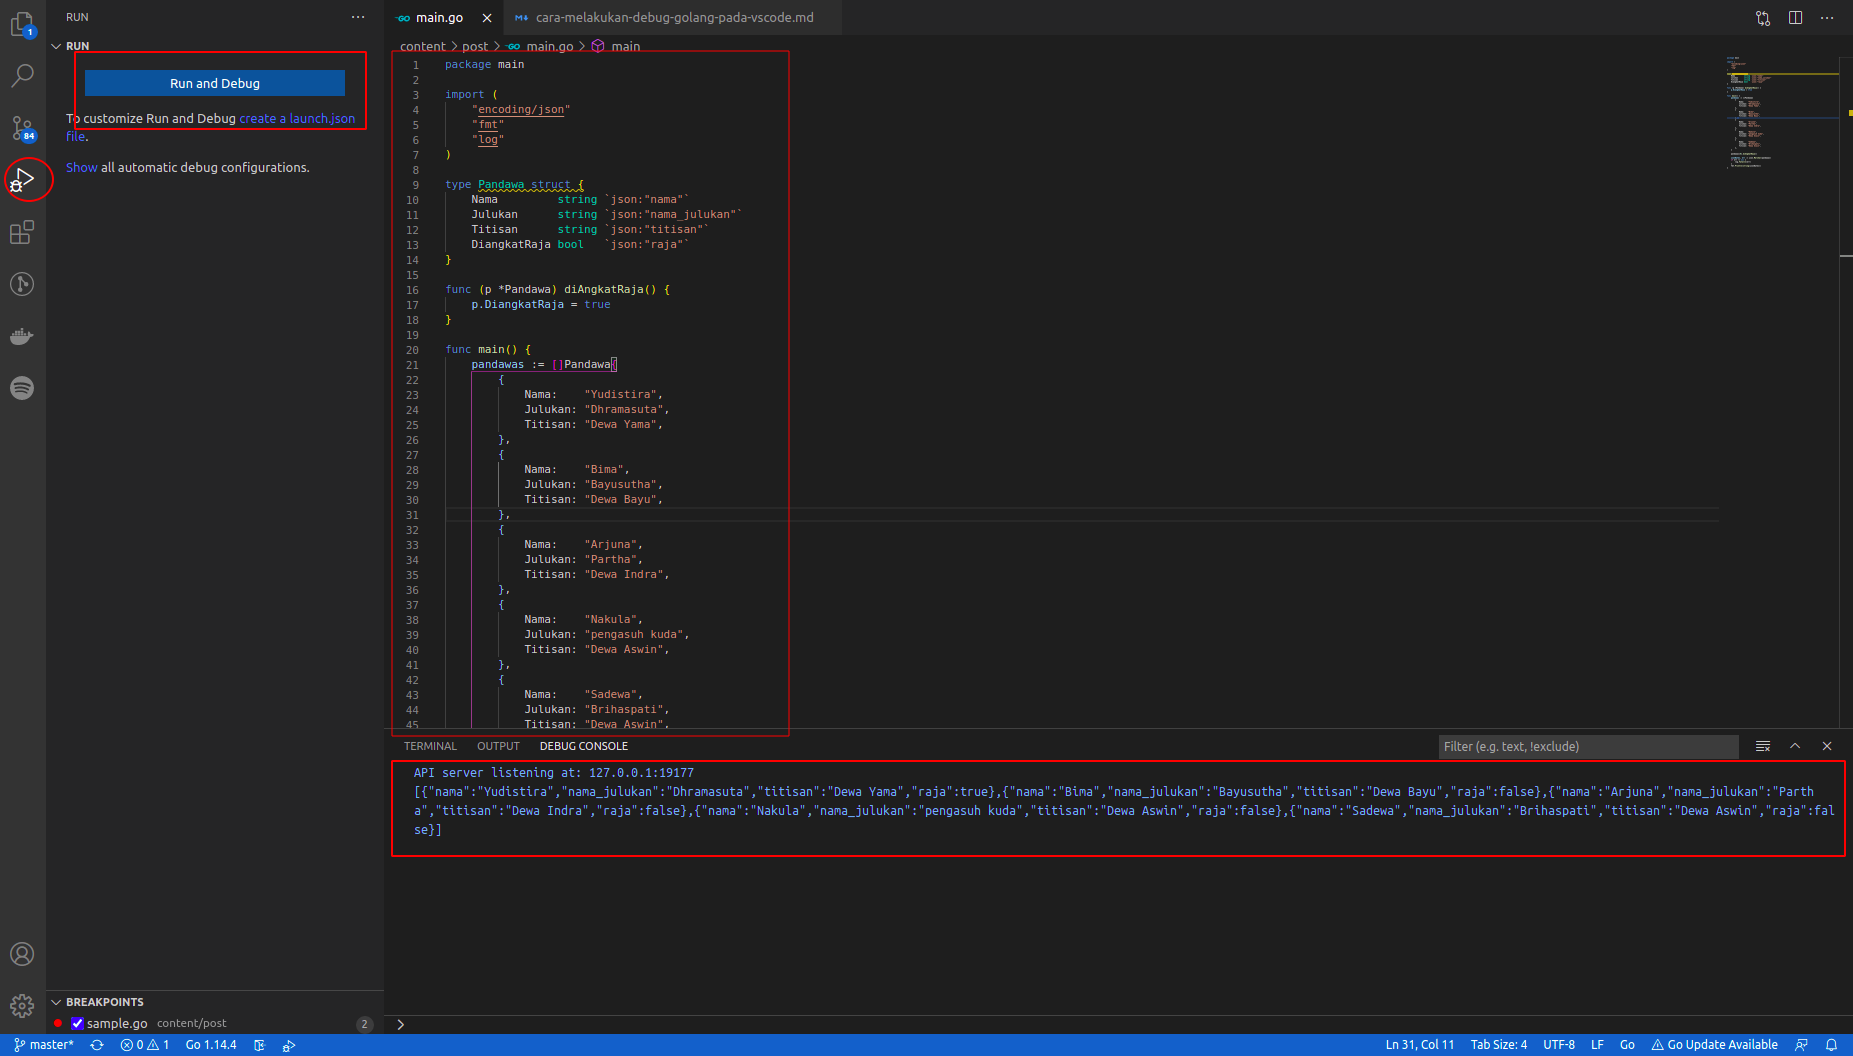
So it will look like the image above if we press the Run and Debug button.
Next, we will add a breakpoint, because we want to know more about how to do debugging in Visual Studio Code.
Add a breakpoint on line 20 by pressing the line number on the left, then you will see red.
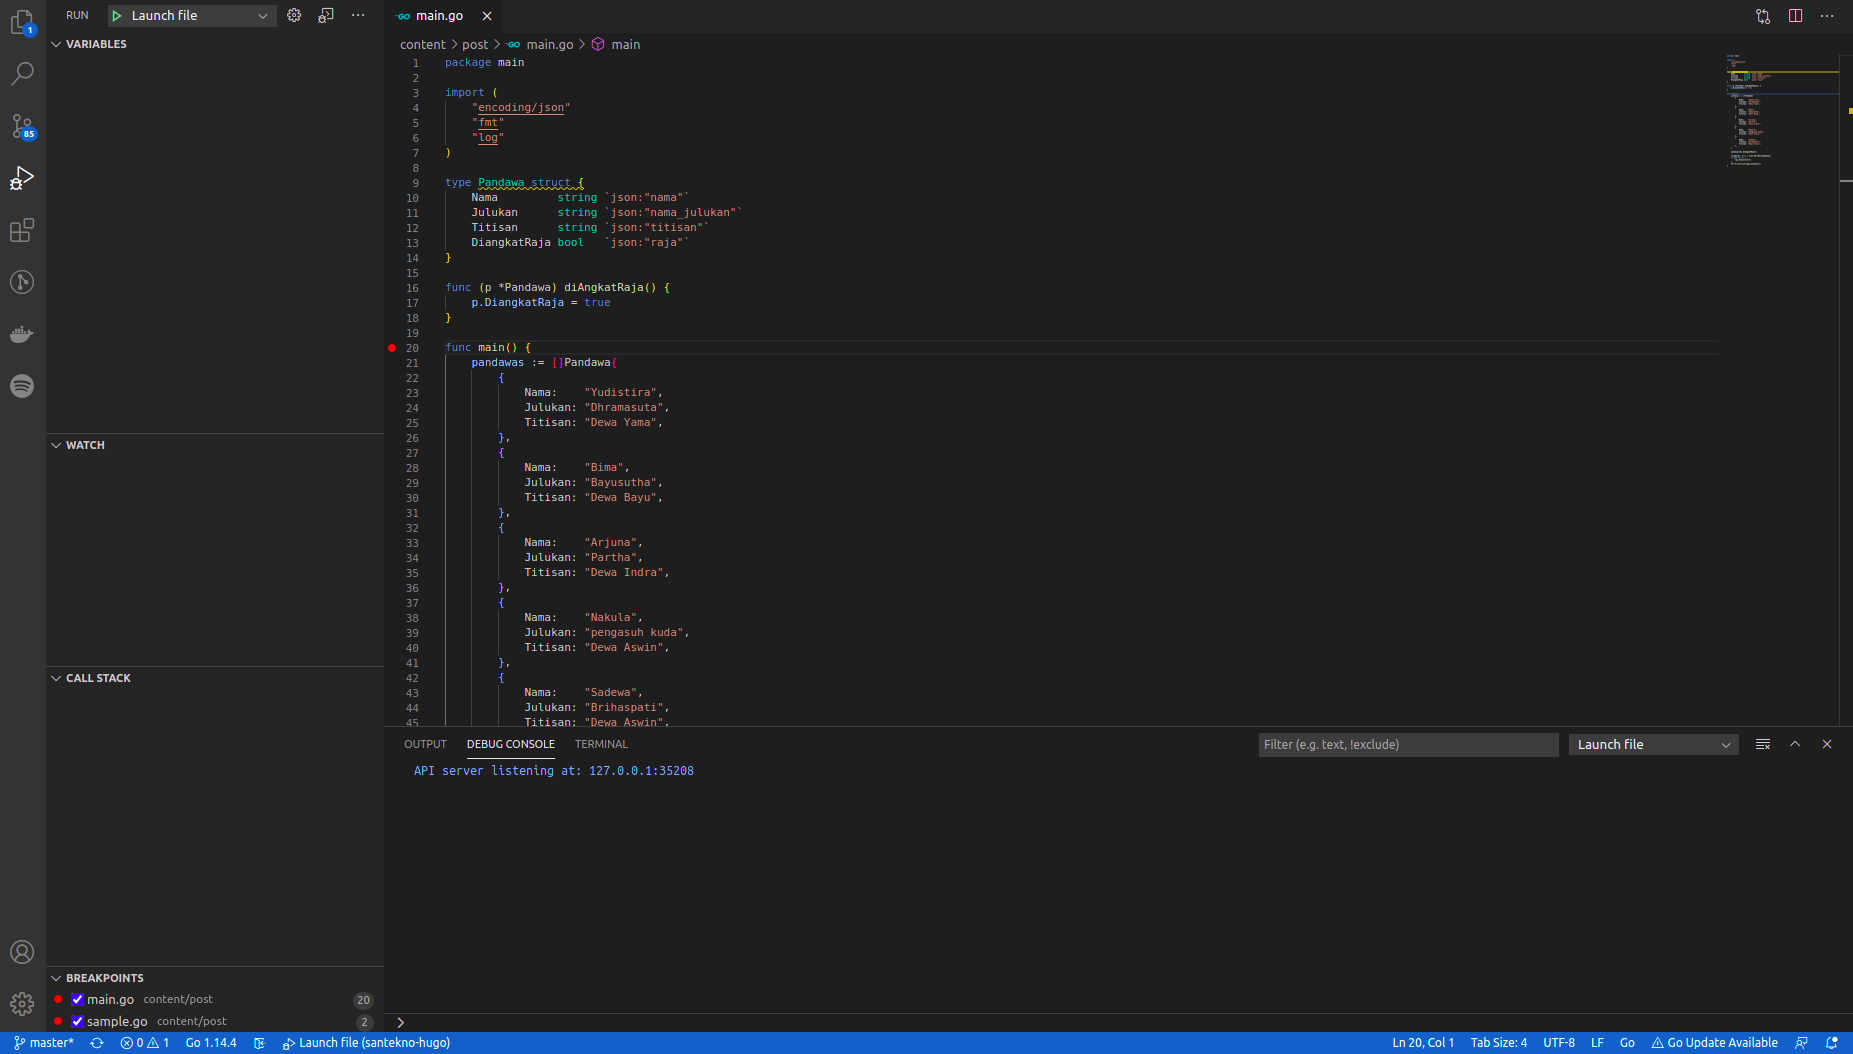
Next, press F5 or press Run and Debug then the debugger will run the application and stop at the red point.
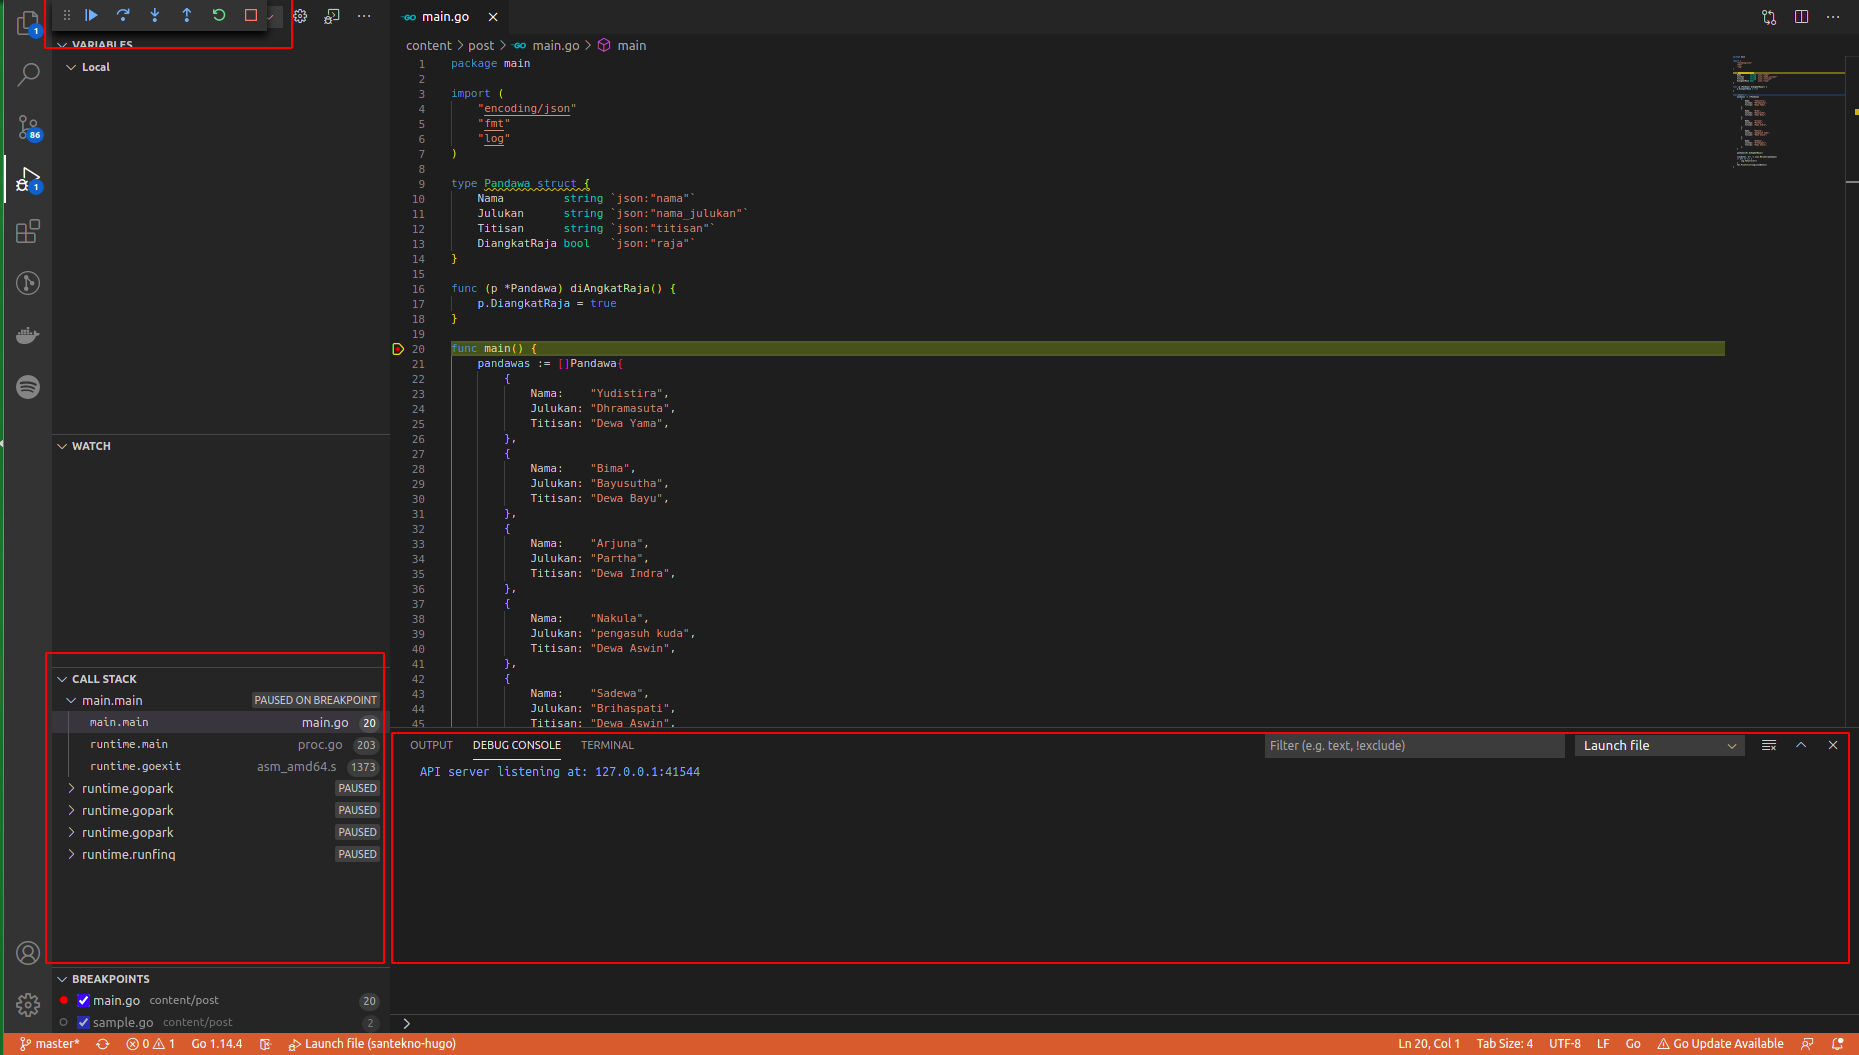
In the section above you can see the application is stuck at a breakpoint, so we can see several variables that are running, even when we check each code we can see changes in the contents of each variable that we have declared.
To see local and global variables, we can look at the left panel, while if we want to see the application progress log, we can look at the red box at the bottom.
One more thing, the Debug Toolbar will appear at the top left near the panel used to travel the application, you can continue, go back, or run all the processes until they are finished.
Next, you press Step Over on the Debug Toolbar, you will see the application stuck on line 49.
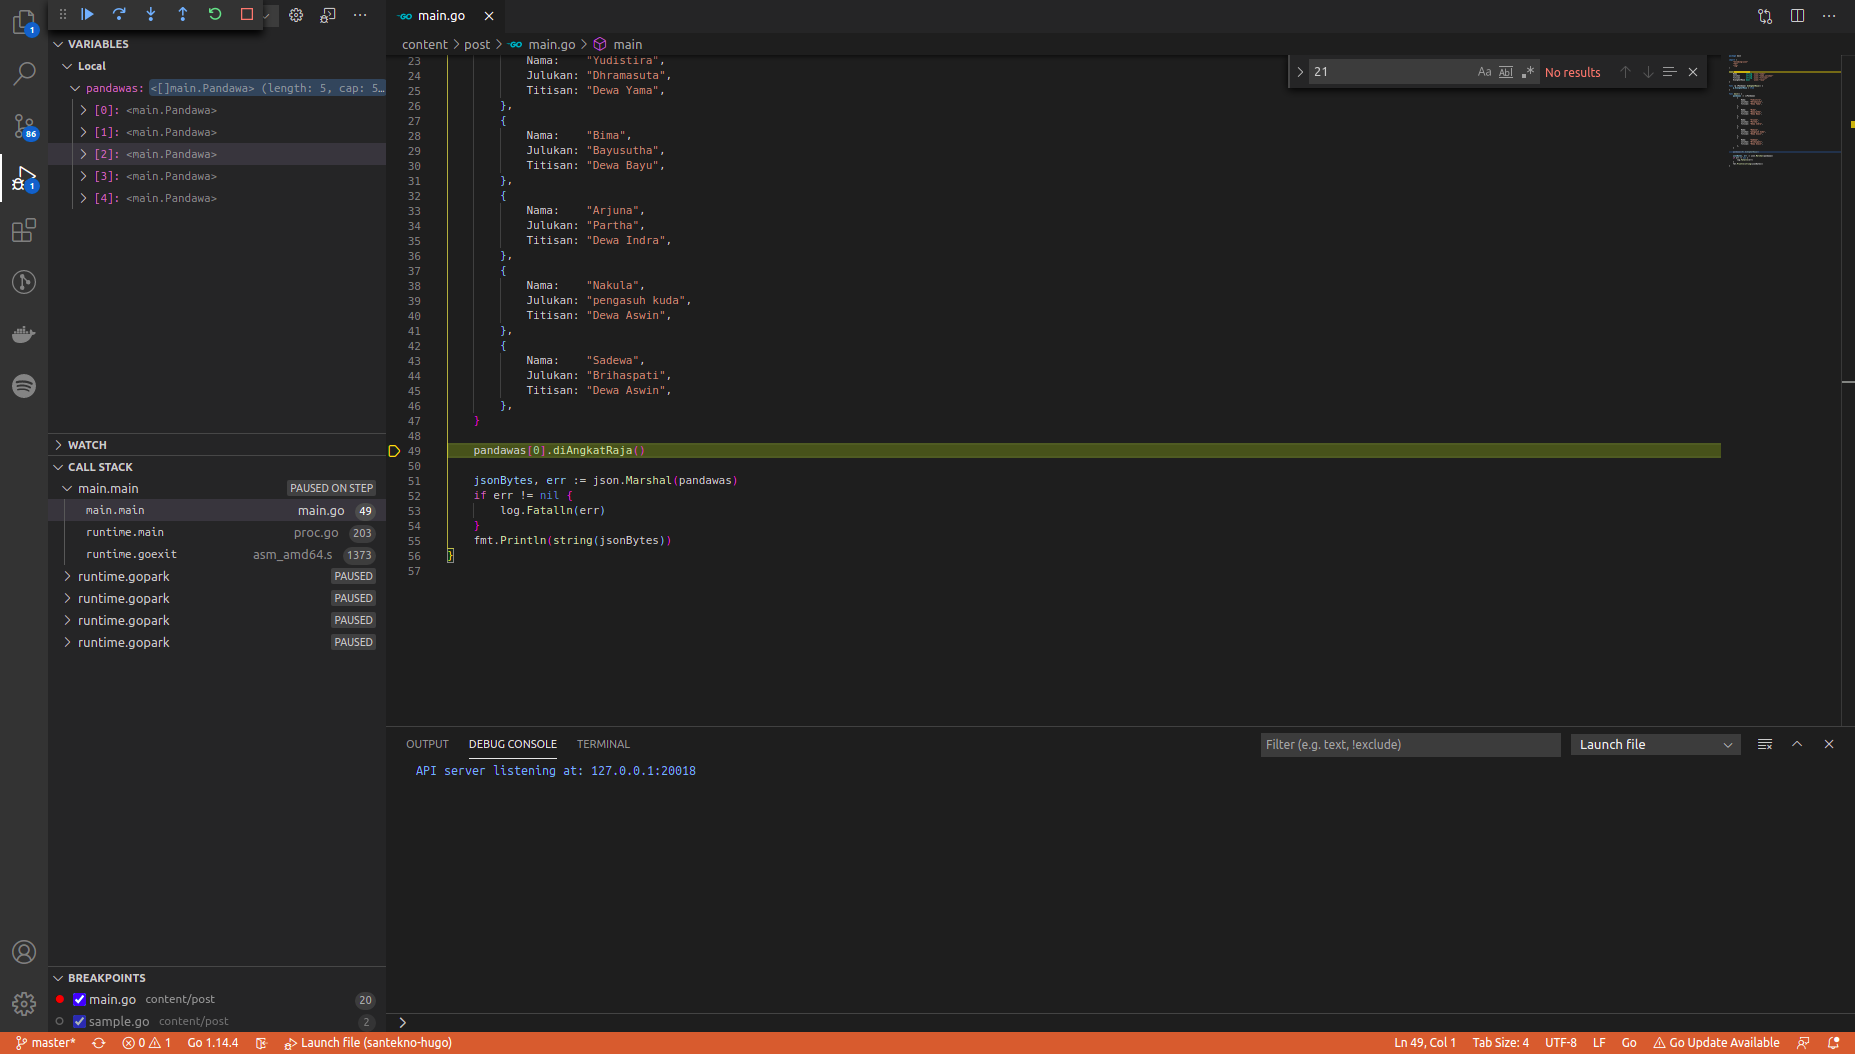
We move to the left panel to see some of the variables that are running at this stop position.
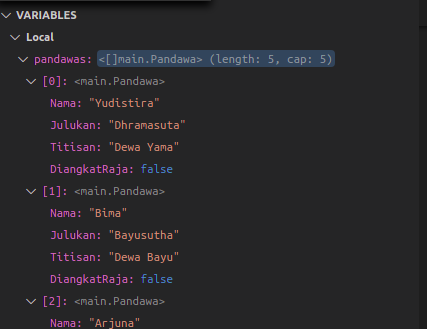
We can see the status and contents of a variable at a certain time and we can also see the stack of processes or functions that are running in the main function.
When we do the Step Over again until we cross line 49, one of the Pandavas, namely Yudistira, is appointed as king.
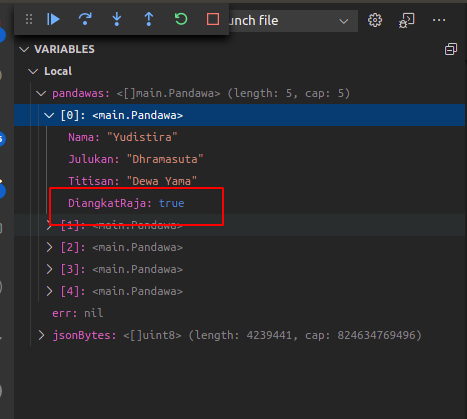
Create Conditions on Breakpoints (red dots)
VSCode breakpoints (red buttons) also give you the option to provide an expression usually this expression is a boolean.
For example, on line 49, pandawas[0].diangkatRaja(), we can add a condition to the breakpoint that will be raised when it is true, for example this breakpoint can run if pandawas[0].Titisan == "Dewa Wind".
To do that, we right click on the line 49 breakpoint and select Edit Breakpoint...
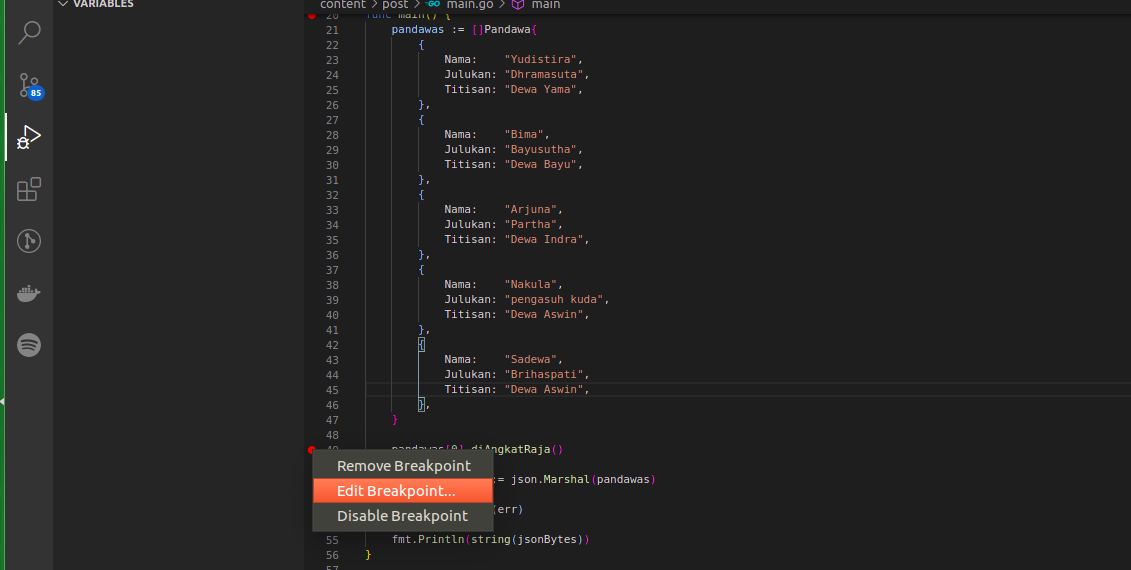
Add the condition that we will make the rule expression then ENTER.
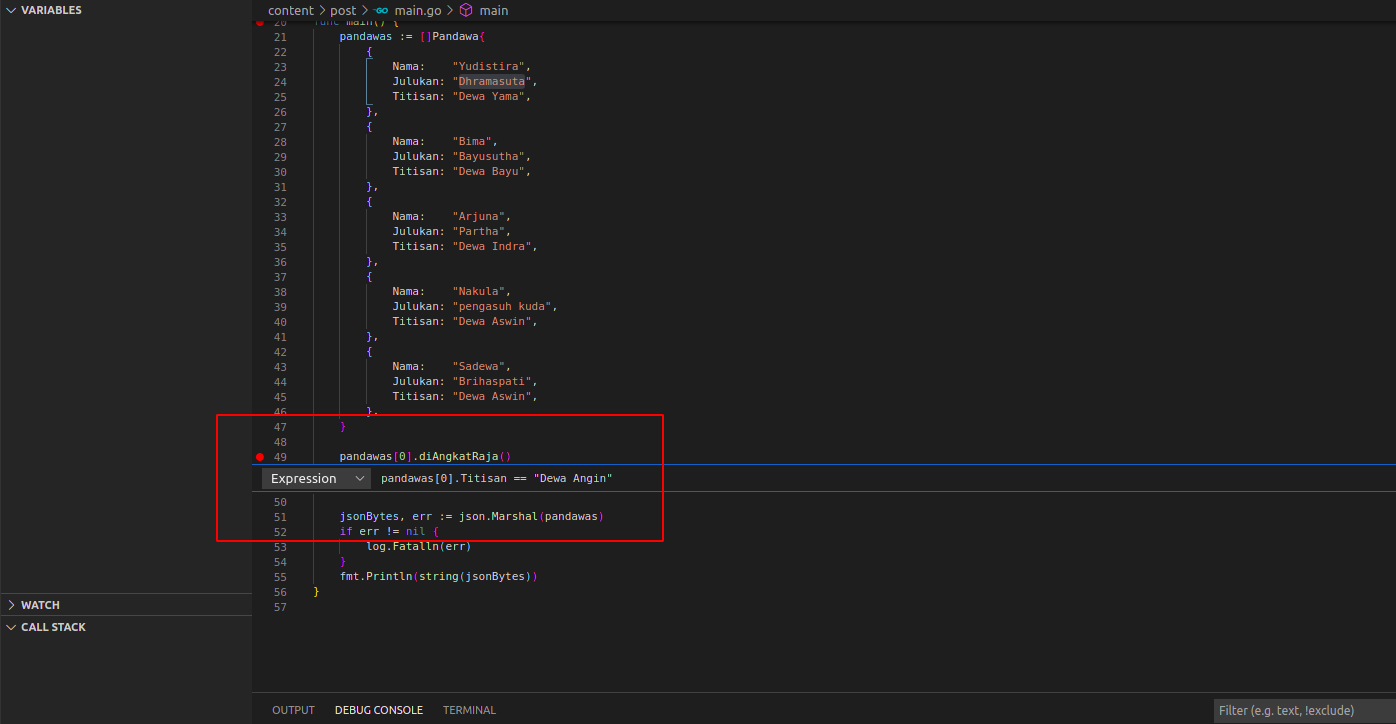
Now we run the debugger by pressing F5, then the debugger will not stop at the breakpoint. The application remains running until you see the results in the debug console panel below.
why doesn’t the debugger stop at that breakpoint? Because of all the pandawas, none has the incarnation of the Wind God, the debugger considers the expression to be FALSE.
If you want the application to stop at these breakpoints, try changing one pandawas namely Yudisthira with the incarnation Wind God, then the debugger will stop at these breakpoints according to the rules. See, you can do it? Good luck.
Debugging unit tests
Apart from directly carrying out debugging on the main application, we can also carry out debugging on unit tests. This unit test is usually created to test our code so that it complies with its requirements.
Let’s try to create a unit test for an arithmetic addition function.
func tambah(a, b int) int {
	return a + b
}
If you use VSCode there is a plugin which can make it easier to create unit tests by just generating them. We can see how to do this below.
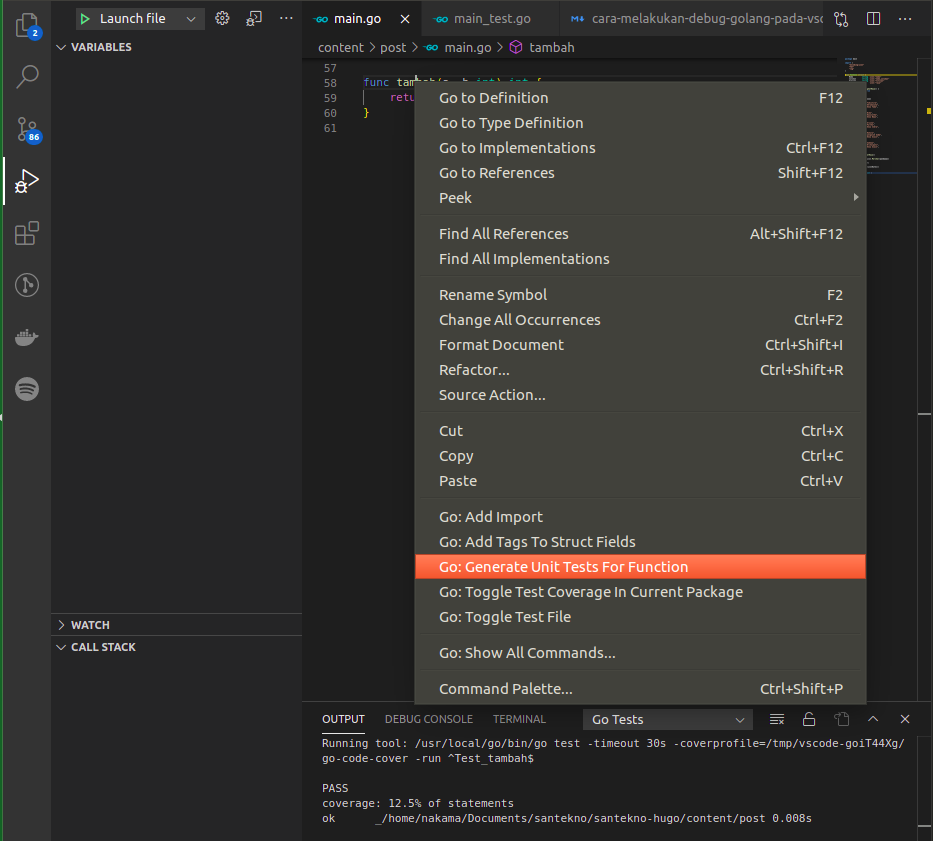
Then a file main_test.go will be created in the same folder, then the results will be like below.
package main

import "testing"

func Test_tambah(t *testing.T) {
	type args struct {
		a int
		b int
	}
	tests := []struct {
		name string
		args args
		want int
	}{
		{
			name:"pertambahan 1+2",
			args: args{
				a:1,
				b:2,
			},
			want: 3,
		}
	}
	for _, tt := range tests {
		t.Run(tt.name, func(t *testing.T) {
			if got := tambah(tt.args.a, tt.args.b); got != tt.want {
				t.Errorf("tambah() = %v, want %v", got, tt.want)
			}
		})
	}
}
If you have VSCode-Go installed, you can also see the options above the unit test function.
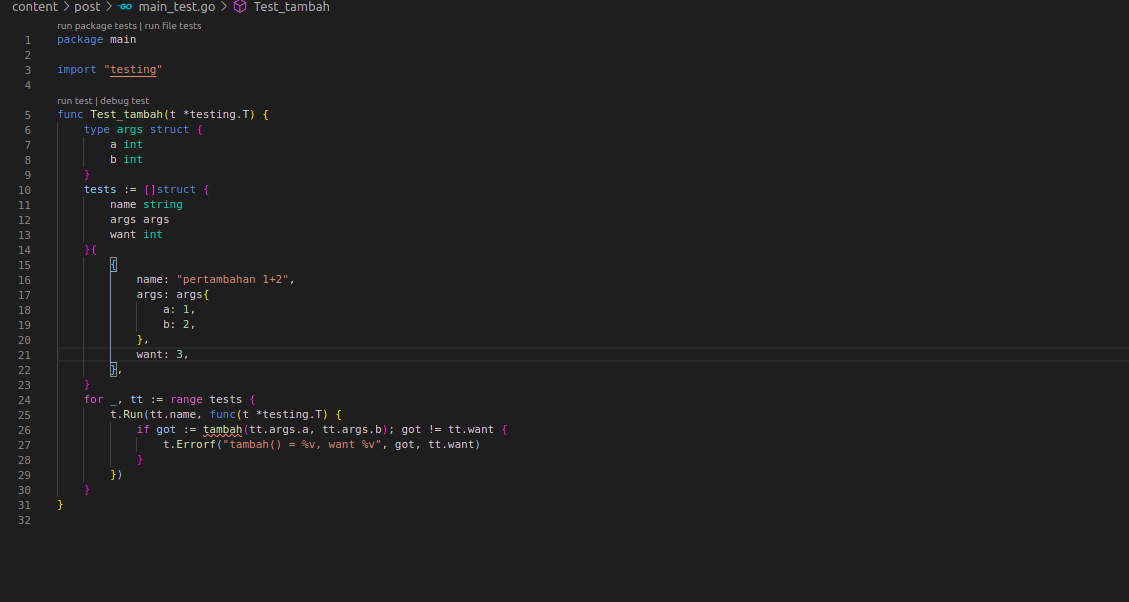
You press run test which is used to run the test then the results will be visible directly in the Output window of the bottom panel and debug test is used to run the unit test but we also want to do breakpoints (stop at a certain line) to check. This can also be done if you need it when debugging unit tests.
Conclusion
Debugging is an important part of software development and for programmers especially if you use Visual Studio Code as the IDE of choice for running coding. VSCode can make it easier for you to do your work because it is supported by the Debugger.
We have explained the basic concept of debugging, so don’t hesitate to use it to support your work. Usually, to make things easier, Golang programmers are used to using fmt.Prinln to get the status or contents of the current variable. Once you get to know debugging, you can at least reduce the addition of code so that your code remains unchanged.
Good luck.
VSCode Extension Often Used in Golang
Getting to know Data Types in Golang
Hot Articles
12 Creating Static File Handler
01 Jan 2025

